Market research results from operational data and experience data should be enhanced with human context, the “why" data.
In this post I’ll help you:
- Learn how companies can more effectively understand experience data and develop consumer-centric solutions.
- Find out how many people you need to talk to in order to understand the why (i.e., the context) behind research findings.
- Learn how targeting who you include in your research influences the number of participants you need.
- Discover how "X data" and “Y data" work together.
When I started my career at General Mills two decades ago, companies were investing millions of dollars into grocery store scanner data to try and understand consumer behavior. These organizations gained competitive advantage by using the acquired operational data to optimize product assortment, pricing, deals and distribution.
In the past few years, experience data has changed the game. Companies like Qualtrics emerged and have grown to unicorn status (a technology startup valued at $1 billion or more) by helping companies capture large-scale customer satisfaction and customer experience data before, during and after the sale.
In a recent Forbes article, Ryan Smith, Cofounder and CEO of Qualtrics, refers to the mainstream operations data as “O data,” and newer experience data as “X data.” Today, everything comes down to the experience people have with their brands.
"Historically, only a handful of cut-throat, thin-margin industries—think airlines, autos and hotels—relied on customer experience to differentiate themselves. Today, Smith says, customer experience as a differentiator is “becoming pretty commoditized.” No longer is the importance of customer experience the province of those three big industries. “Now it’s [affecting] health care, it’s retail, it’s universities, it’s Uber, it’s Air BNB. People are choosing experience over price or experience over brand all the time. So we’ve truly become an ‘experience economy.’” - Ryan Smith
The exciting part of “X data” is that it’s more consumer-centric than “O data.” It can help us segment our consumers and identify customer problems and opportunities.
Sometimes these problems or opportunities are relatively low-risk and can be implemented quickly and easily. However, “X data” often reveals problems or opportunities that can be solved in many ways. This creates gaps between knowing the problem or opportunity and being able to identify the right solution to move forward with.
For example, when  Dannon wanted to reposition their flagship yogurt product, they had lots of “O” scanner data and “X” survey data to tell them why Greek yogurt brands were outperforming traditional yogurt. The Dannon team also had some early ideas for new packaging and positioning to turn their brand around.
But they only had a few weeks to make some key decisions before taking their final concept to volumetric testing. Dannon could have just discussed and developed ideas based on the information they already had. But they had several possible directions to take with respect to both packaging and positioning concepts, and it would have been costly and time consuming to test all of them. They couldn’t take the risk picking just one, because if they got bad testing scores they would need to go back and rework their ideas—which would severely delay the launch.

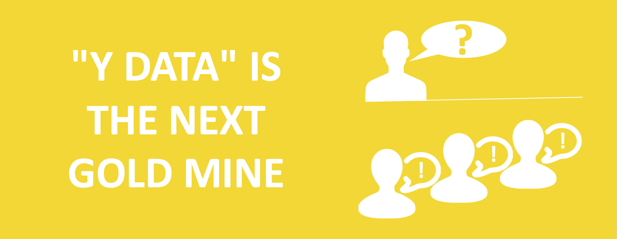
“Y data” is short for “why data.” It consists of the qualitative insights that come from engaging people in discussion, understanding context, and building emotional empathy.
“Y data” goes beyond the open-ended questions of a survey, and it’s more than just analyzing text in social media. It involves finding a highly targeted group of consumers that have the problem you want to solve, engaging those people in an environment where they can reflect and convey their experiences while providing recommendations or co-creating solutions with your brand.
Historically, focus groups and on-site/ethnographic research has filled this void. But that approach takes weeks and costs tens of thousands of dollars—if not more.

Unlike “O data” and “X data,” the key to collecting effective “Y data” isn’t contingent on the size of the sample you collect or the statistical analysis you run. Instead, it’s about targeting and focusing on a specific consumer and an associated problem or opportunity.
But before I share what effective “Y data” looks like, let’s look at the kind you probably want to avoid.
In the late '90s, I was assigned best practices in qualitative and ethnographic research at Pillsbury. I was invited to a research and development (R&D) work session where we were analyzing “Y data” collected from observing and engaging 25 consumers as they cooked dinner.
There, each member of the team was tasked with writing one key observation gleaned from the research on a sticky note. We spent time grouping the sticky notes into themes. After hours of work, the team was confused by the results.
While many people were seeking “faster” dinner solutions, everyone had a different definition of what that meant. For some people, a “fast” dinner was cooked in 20 minutes. For others, 60 minutes was fast enough.
As a result of these different findings, it wasn’t clear where we should direct our focus—despite the fact that we identified many problems and opportunities.
In this case, Pillsbury had collected “Y data” as if it were “X data” or “O data.” The company focused on interviewing as representative a group of people as we possibly could. And we ended up collecting too broad a spectrum of insights to get meaningful results.
There’s a better way.

When “Y data” is collected correctly, it gives organizations a high degree of confidence in three distinct ways:
- Consensus: If Pillsbury’s R&D team had used existing “X data” to narrow in on the most dissatisfied group (mothers) and when they were least satisfied with cooking (weeknight dinners), the “Y data” experience would have been completely different. Talking to 25 women in this segment would have been sufficient to consistently hear that 20 minutes was their threshold for weeknight dinners, and that one major wish was to enhance the taste of vegetables for their kids—without having to clean dirty pots and pans.
- Inspiration: When you understand the problem, the context, and the human emotion you are satisfying, solutions jump out at you. And those solutions are the seeds needed to build consumer-centric brands. In this case, it wouldn't have been a big leap for the team to create microwavable steam bag vegetables as part of a 20-minute dinner.
- Iteration: When you ask consumers to react to your early ideas—or even brainstorm solutions with your team—you learn when you might have misinterpreted your consumers. For example, if a senior team member thought that one way to help moms enhance their vegetables was to use bright colored sauces, "Y" data would allow them to hear moms explain why that won't work. "Maybe it would be fun for the kids, but it’s not going on the dinner table for my whole family." Knowing why saves the team a ton of time and money. You don't pursue a doomed-to-fail product just because it you didn't have enough context to eliminate it as a potential solution.
The benefits of “Y data” speak for themselves. But how exactly can you go about leveraging it most effectively?
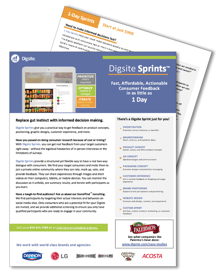
Today, new online and mobile tools like Digsite allow companies to get “Y data” in as little as 24 hours—and at a fraction of the cost of traditional qualitative research. This means that teams can make course corrections even when they’re driving 90 miles per hour down the highway.
Now, some of you might feel that you are spread too thin to collect “Y data” for every new product, ad campaign, website, or customer experience program you develop—and that your teams are comfortable using in-person research to collect this kind of data.
There’s good news: Companies like us here at Digsite have focused on building software solutions and combining them with expert consultants to make it fast, easy and affordable for you to get expert results.
So, if you need “X data,” check out our friends at Qualtrics. They have some amazing tools that can be used to collect and segment employee, customer, product, and brand experience data.
If you have a known problem or opportunity that’s keeping you up at night, and you need more “Y data” in your life, check out Digsite Sprints.
To learn more about how your company can benefit from Y Data, check out our Digsite Sprints Fact Sheet!